State of x402: November 2026
By the youraitools.co team · Published Nov 1, 2026 · · CC BY 4.0
How many x402 APIs are online, how many return a valid payment request, what a call costs and how fast they answer. Built only from YourAITools' own daily unpaid checks. Data as of November 1, 2026, 1:01 PM ET.
x402 lets an API charge per call: the server answers an unpaid request with HTTP 402 and machine-readable payment terms, and an AI agent pays in USDC and retries. We track 372 x402 and agent-payment listings and send each one an unpaid request every day. We never pay. This report rolls those checks up into one picture of the market.
Key findings
- 372 listings across 14 categories. 348 have a public paid endpoint we can check; the other 24 list no example endpoint.
- 97.4% online. 339 of the 348 checked endpoints answered at our latest check. Across all 2,017 daily checks since October 27, 98.4% were up.
- 95.7% return a valid x402 payment request. 333 of 348 answered HTTP 402 with complete x402 terms (scheme, network, payTo and amount). 328 of those use x402 v2.
- $0.01 median price per call. Across 318 APIs whose 402 named a USDC price within their listed range. 47.2% charge under one cent.
- 462 ms median response time for the unpaid 402 check (median of per-API 7-day medians); p90 is 1,014 ms. 310 of 346 APIs answer in under one second.
- Server errors lead the failure list. Of the 15 endpoints that did not return a valid payment request, 4 returned an HTTP 5xx, 2 timed out, and 2 were TLS errors on our checker's side.
- Base dominates settlement. 313 of the 318 priced 402 responses named a Base USDC option; 150 offered more than one payment option.
- Prices were stable in the first week. Only 1 of 318 tracked prices changed. Our price history is too short to call a trend yet.
How many x402 APIs exist, by category
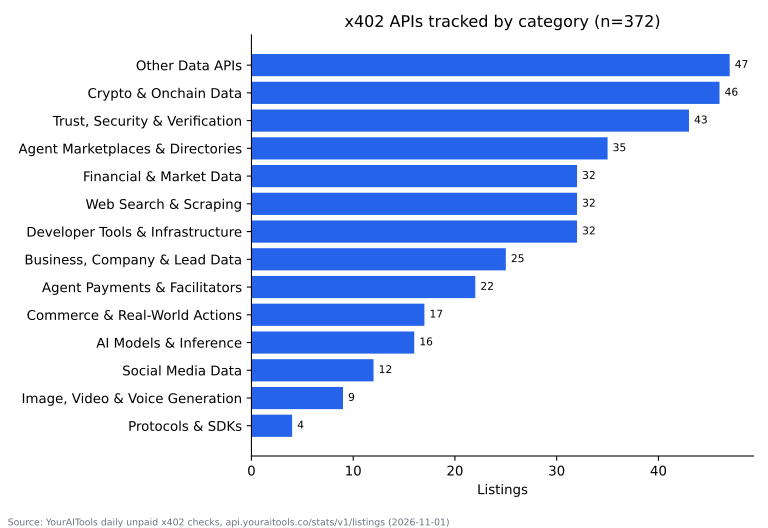
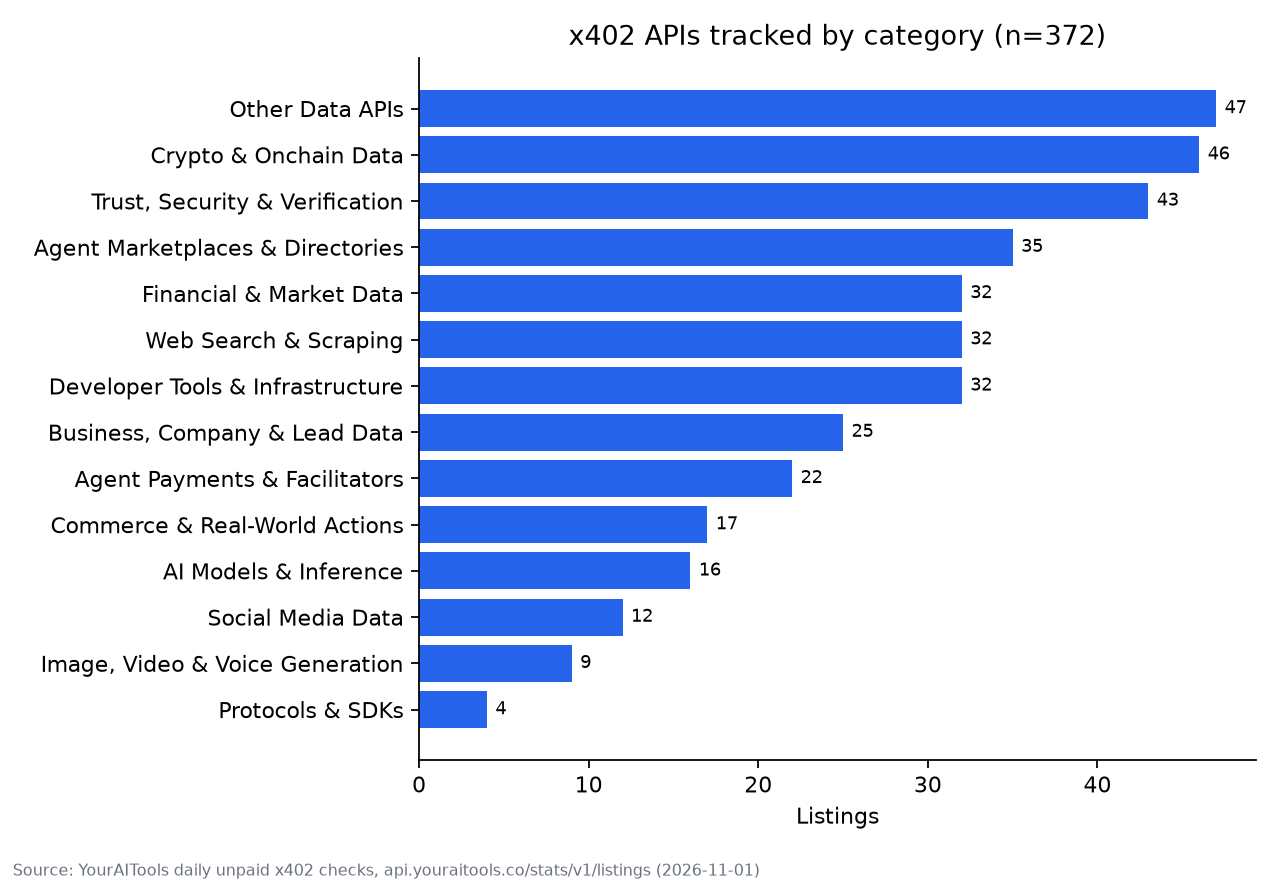
We list 372 services. 363 use x402 alone; the rest combine x402 with other agent-payment methods or are adjacent payment tools. This is a count of what YourAITools lists and monitors, not the whole ecosystem.
| Category | Listings | Checked | Online | Valid x402 | Priced | Median price | Median latency | p90 latency |
|---|---|---|---|---|---|---|---|---|
| Other Data APIs | 47 | 47 | 97.9% | 97.9% | 45 | $0.01 | 461 ms | 1,255 ms |
| Crypto & Onchain Data | 46 | 46 | 93.5% | 89.1% | 37 | $0.005 | 449 ms | 1,007 ms |
| Trust, Security & Verification | 43 | 40 | 90.0% | 90.0% | 36 | $0.01 | 526 ms | 1,030 ms |
| Agent Marketplaces & Directories | 35 | 31 | 100% | 93.5% | 28 | $0.005 | 480 ms | 924 ms |
| Developer Tools & Infrastructure | 32 | 30 | 100% | 100% | 28 | $0.005 | 404 ms | 710 ms |
| Web Search & Scraping | 32 | 32 | 100% | 96.9% | 30 | $0.005 | 497 ms | 911 ms |
| Financial & Market Data | 32 | 31 | 100% | 100% | 31 | $0.01 | 393 ms | 950 ms |
| Business, Company & Lead Data | 25 | 25 | 100% | 100% | 24 | $0.01 | 497 ms | 1,615 ms |
| Agent Payments & Facilitators | 22 | 13 | 100% | 100% | 13 | $0.01 | 492 ms | 866 ms |
| Commerce & Real-World Actions | 17 | 17 | 100% | 100% | 16 | $0.01 | 539 ms | 841 ms |
| AI Models & Inference | 16 | 15 | 100% | 100% | 12 | $0.0075 | 298 ms | 785 ms |
| Social Media Data | 12 | 12 | 100% | 100% | 11 | $0.014 | 423 ms | 1,456 ms |
| Image, Video & Voice Generation | 9 | 9 | 88.9% | 77.8% | 7 | $0.01 | 569 ms | 2,676 ms |
| Protocols & SDKs | 4 | 0 | – | – | 0 | – | – | – |
| All | 372 | 348 | 97.4% | 95.7% | 318 | $0.01 | 462 ms | 1,014 ms |
Data APIs make up the largest group, followed by crypto and on-chain data and by trust, security and verification tools. Together these three account for 136 listings (36.6%). Protocols & SDKs are libraries rather than paid endpoints, so none of them has a check.
What share of x402 APIs are online?
At our latest check, 339 of 348 endpoints (97.4%) were up, meaning they returned an HTTP answer below 500 that was not 404 or 410. Leaving out the 13 listings whose check we are still adjusting on our side gives almost the same figure: 326 of 335 (97.3%).
Over the full measurement window (October 27 to November 1), 1,985 of 2,017 daily checks were up (98.4%). By day, the online share ranged from 97.4% to 99.1%. Of the 348 checked APIs, 335 have answered every check in the past seven days.
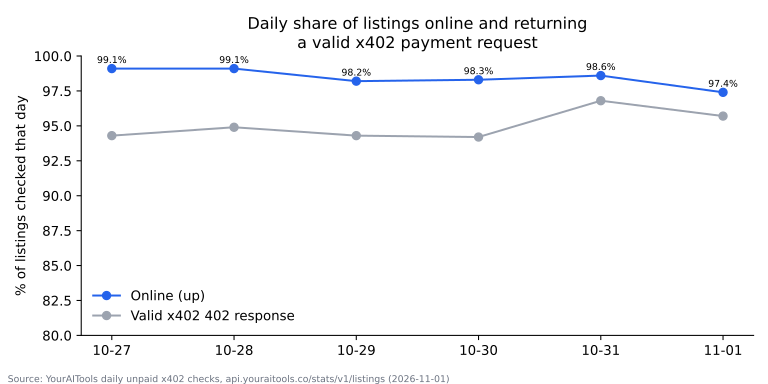
"Down at the last check" is stricter than what our down-right-now page shows. That page lists an API only after two failed checks in a row and leaves out errors on our own side. At 12:18 PM ET on November 1 it showed 3 APIs down: two with server errors and one timing out.
What share return a valid x402 payment request?
Being online is not enough for an agent: the endpoint also has to return a usable payment request. 333 of 348 (95.7%) answered with HTTP 402 and complete x402 terms. Across all daily checks the rate was 95.0% (1,917 of 2,017).
- x402 version: 328 valid responses use v2 (the PAYMENT-REQUIRED header) and 5 use v1 (JSON body).
- Price fit: 15 valid responses named no USDC option inside the listing's published price range, so we report no price for them.
- Spec quality: our free x402fix check grades the payment request itself. Of 348 graded endpoints, 195 got an A, 91 a B, 25 a C, 8 a D and 29 an F, so 82.2% scored A or B. Compared with the October 31 baseline (A 196 / B 90 / C 25 / D 8 / F 29), one endpoint moved from A to B.
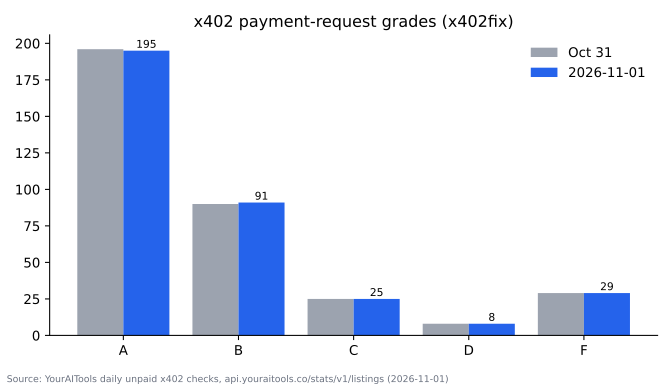
A grade rates the payment request, not uptime, and it is not an endorsement.
Median price per call by category
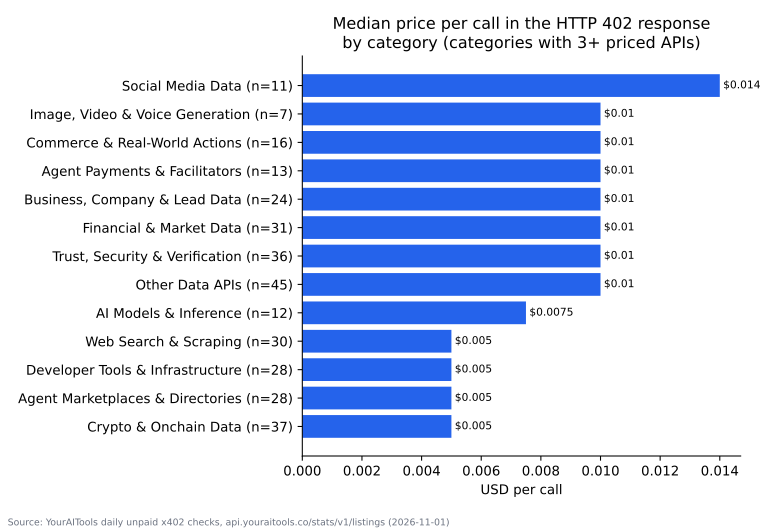
We read the price straight from each 402 response, never from marketing pages. Across 318 priced APIs, the median is $0.01 per call and the 90th percentile is $0.056.
| Price per call | APIs | Share |
|---|---|---|
| Under $0.001 | 1 | 0.3% |
| $0.001 to under $0.005 | 95 | 29.9% |
| $0.005 to under $0.01 | 54 | 17.0% |
| $0.01 to under $0.05 | 113 | 35.5% |
| $0.05 to under $0.10 | 24 | 7.5% |
| $0.10 to under $1 | 22 | 6.9% |
| $1 or more | 9 | 2.8% |
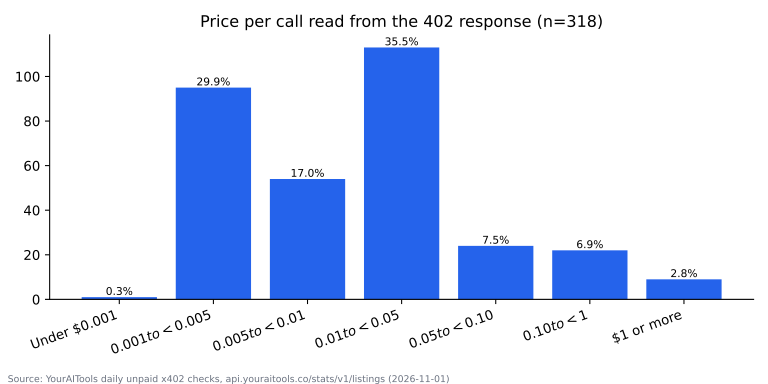
By category, medians sit in a narrow band:
- Social Media Data has the highest median at $0.014.
- $0.01: most categories, including financial, business and trust data.
- $0.005: crypto data, web search and scraping, developer tools, and marketplaces.
The highest single prices are usually bundles, media generation or multi-step jobs rather than single lookups. Pricing models split between 206 dynamic (ranges, tiers or "up to") and 165 fixed, plus 1 prepaid.
Networks. For 313 of the 318 priced APIs the price we report is a Base USDC option; for the other 5 it is a Solana USDC option (we prefer Base when both fit the listed price). 150 offered more than one payment option, for example several networks or schemes.
Latency: how fast x402 APIs answer
We time the unpaid request that returns the 402, so this measures how quickly an agent learns the price, not how long the paid work takes. Per API we take the median of its "up" checks over seven days, then summarize across APIs:
- Median of per-API medians: 462 ms. p90: 1,014 ms.
- Distribution: 191 of 346 APIs (55%) answer in under 500 ms and 310 (90%) in under one second; 7 take two seconds or more.
- Latest check alone: the median across the 339 up endpoints was 454 ms and the p90 was 1,197 ms.
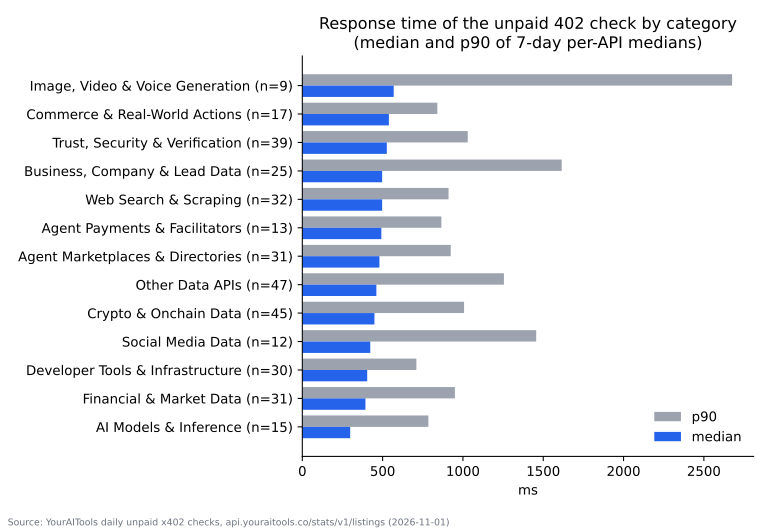
- Fastest median: AI Models & Inference (298 ms), then Financial & Market Data (393 ms) and Developer Tools (404 ms).
- Widest tail: Image, Video & Voice Generation, with a p90 of 2,676 ms on a small sample of 9.
Most common failure types
At the latest check, 15 of 348 endpoints (4.3%) did not return a valid x402 payment request. Grouped by cause:
| Failure type | Endpoints |
|---|---|
| Server error (HTTP 5xx) | 4 |
| Timeout (no answer within 8 s) | 2 |
| Asked for other authentication (HTTP 401/403) | 2 |
| Rejected the unpaid request (HTTP 400) | 2 |
| TLS error on our checker's side (HTTP 525, not the service's fault) | 2 |
| HTTP 402 without complete x402 terms | 1 |
| Rate limited (HTTP 429) | 1 |
| Endpoint not found (HTTP 404) | 1 |
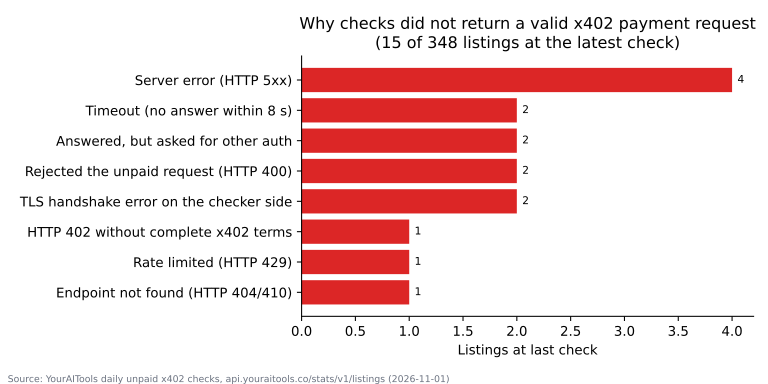
Hard outages (5xx, timeouts, 404) account for 7 of the 15. The other 6 endpoints, excluding the 2 checker-side TLS errors, were online but not agent-ready: they asked for an API key, rejected a request without a body, rate-limited us, or returned a 402 missing part of the payment terms. These are usually fixable configuration issues, and our free x402 endpoint check flags most of them.
How prices have changed
Honest answer: too early to say. Our per-listing price history records each change to the price seen in the 402 response. For most listings it starts October 31 or November 1, 2026.
- Since then: 1 of 318 tracked prices changed, rising from $0.0015 to about $0.0128 per call on November 1.
- Older numbers aren't comparable. On October 30 our x402 API prices page reported a $0.005 median across 322 APIs. That figure used a different measure: the lowest price among all routes we probed per API. This report uses the price on each listing's example endpoint, so the two numbers are not a trend.
We will report month-over-month changes using the same definition starting with the December edition.
Methodology
Sources. All figures come from our public stats API, api.youraitools.co/stats/v1/listings (generated 2026-11-01 18:01:33 UTC, 1:01 PM ET). Categories come from the directory index youraitools.co/listings.json. The down-right-now count comes from /status/down-right-now. The aggregated tables behind every figure are free to download below (summary.csv and stats.json), and the full per-listing feed is public at the stats API above.
How we check. Each listing's example endpoint gets one unpaid request per day:
- It is sent with a user agent that identifies our checker.
- It never carries a payment header and does not follow redirects.
- It times out after 8 seconds, with no retries.
Definitions.
- Up: an HTTP answer below 500 that is not 404 or 410.
- Valid x402: HTTP 402 with x402 terms naming scheme, network, payTo and amount.
- Price: the USDC option in the 402 that fits the listed price range, preferring Base.
- Latency: the time to the 402 answer, measured from our checker.
- Grade: our free x402fix check of the payment request.
Sample. 372 listings, 348 with a checkable endpoint, 318 with a price read from the 402. The window runs October 27 to November 1, 2026: six UTC days and 2,017 checks.
Limitations.
- The window is short; most listings have 5–6 checks.
- One request a day misses short outages.
- Latency is measured from one location and covers the 402 handshake, not paid work.
- 13 listings have a check we are still adjusting, which may reflect our setup rather than the service.
- The directory is curated, so it is not a census of every x402 endpoint.
- We list services and also run our own x402 tools. Our own tools are not among the 372 listings.
License. Data is CC BY 4.0. Please cite "YourAITools, State of x402: November 2026" and link to this page. Live numbers are on the x402 status page and the weekly uptime leaderboard.
Download the data (CC BY 4.0)
- summary.csv: every table in this report (categories, price bands, failure types, daily checks, grades).
- stats.json: the same figures as structured JSON, with the source timestamps.
- Charts as SVG and PNG under /reports/state-of-x402-2026-11/charts/ (01 to 07).
- Live per-listing data: /stats/v1/listings and the directory index /listings.json. Field guide and citation: our open dataset page.
Cite as: YourAITools, “State of x402: November 2026”, youraitools.co, Nov 1, 2026, https://youraitools.co/reports/state-of-x402-2026-11. Licensed CC BY 4.0.
Live x402 API status · Down right now · Weekly outage note (week 44) · x402 API prices